
Cold Chain Statistics: Temperature Excursions, Spoilage and Cost
The cold chain is a business worth roughly $400 billion a year whose failures show up as spoiled vaccines, dumped produce and a $35 billion pharma figure everyone quotes and few can trace. Here are the numbers, their sources, and what they mean.
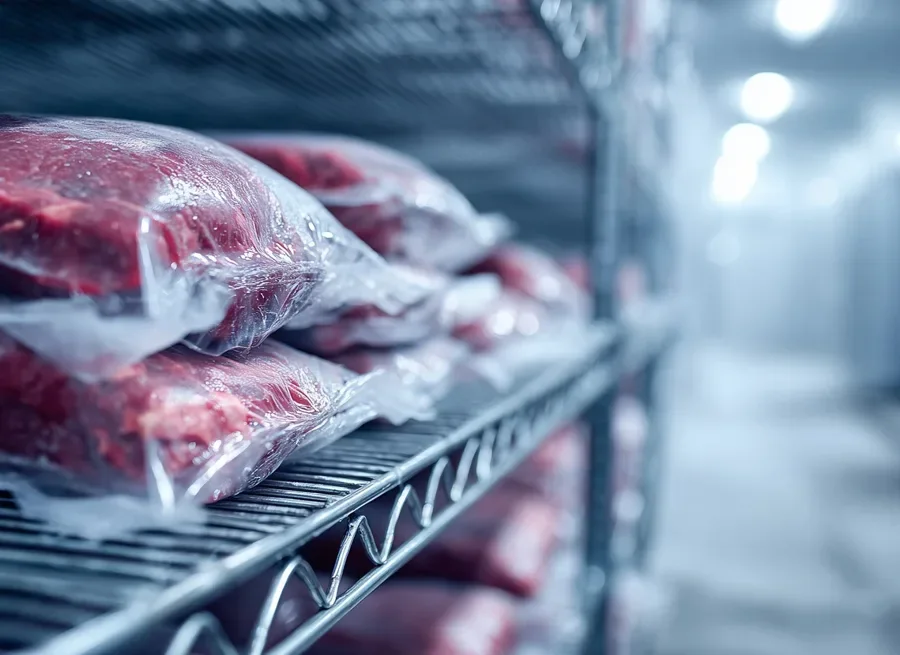
Key findings
- Global Market Insights sizes cold chain logistics at $382.3 billion in 2025, heading to $1.37 trillion by 2035 at a 13.8% compound annual growth rate, with food the larger share and pharma the faster-growing one.
- The $35 billion annual pharma loss figure traces to a 2019 IQVIA Institute estimate circulated with Peli BioThermal's cold chain survey. The underlying document is not public and the number has not been updated since.
- WHO's 2005 wastage guidance reports "over 50% vaccine wastage around the world" (UNEP's 2020 summary renders it "up to 50%"), and FAO puts 13.3% of the world's food lost between harvest and retail in 2023.
- Lack of refrigeration costs 526 million tonnes of food a year, 12% of global production (UNEP and FAO). In the United States, ReFED counts 70 million tons of surplus food in 2024, 12.9% of it attributed to spoilage.
- Regulators now define the monitoring standard: calibrated data loggers, continuous records, three-year retention under CDC guidance, and particular attention at transit hubs under EU GDP. The handoff is where the rules and the losses both point.
Stand on a receiving dock in July and watch a reefer open. The driver has a temperature printout. The receiver has a probe thermometer. Neither knows what happened to the third pallet from the back during the 50 minutes the trailer sat at a cross-dock with its doors open. That pallet is the cold chain. Everything else is infrastructure around it.
What is cold chain logistics? Strictly, it is the storage and movement of goods inside a temperature-controlled environment, which WHO defines as "any environment in which the temperature is actively or passively controlled at a level different from that of the surrounding environment within precise predefined limits." In practice it is cold warehouses, reefer trailers, insulated packaging, data loggers and the procedures that connect them. For every figure here we name the publisher, the year and the population; where a widely quoted number has a murky origin we say so, and what we could not verify we left out. Each section closes on what the numbers mean for a cold chain operation.
How Big Is Cold Chain Logistics?
Cold chain logistics is one of the fastest-growing corners of the logistics industry, pulled along by biologics, online grocery and the simple fact that more of the world's food is now expected to arrive chilled. The estimates below come from one research house, Global Market Insights (September 2026). Its segment growth rates all run above its 13.8% headline rate, so read the splits as directional.
Food and beverage remains the larger application, projected at $341.5 billion by 2035 at a 15.0% CAGR, against $171.3 billion for pharmaceuticals and healthcare growing at 16.3%. Chilled product (0°C to 8°C) is the largest temperature band at a projected $283.7 billion, while frozen (-18°C to -25°C) grows fastest at 16.1% a year. Asia Pacific is the largest regional market at $152.5 billion in 2026.
Cold Storage Capacity Is Growing Fast
The physical footprint of the largest operators is expanding to match. The Global Cold Chain Alliance (GCCA), the trade body for temperature-controlled warehousing and logistics, publishes an annual list of its largest members.
| GCCA measure | 2024 list | 2025 list |
|---|---|---|
| All GCCA warehouse members, capacity owned or operated | 7.39 billion cu ft (209 million m3) | 8.16 billion cu ft |
| Global Top 25 | 6.67 billion cu ft (189 million m3) | 7.3 billion cu ft |
| North American Top 25 | 4.7 billion cu ft (133 million m3) | 5.0 billion cu ft |
| Capacity added to the Global Top 25 since the prior list | 606 million cu ft | 640 million cu ft (about 9.6%) |
Capacity represented by GCCA members grew more than 10% into 2025, and in the association's words, "even with the higher costs of capital, the growth in the industry across all regions in 2024 outpaced the prior two years." GCCA adds a caveat worth keeping: the Top 25 additions reflect acquisitions and new facilities, and "this does not suggest the general industry grew at this pace."
The Pharma Slice
Pharmaceutical Commerce's Biopharma Cold Chain Sourcebook, in its ninth edition by 2018, tracked the pharma segment. Its 2016 edition put cold chain at 19% ($12.6 billion) of a $78.8 billion pharma logistics market, rising to 22% ($16.7 billion) by 2020; the 2018 edition counted "more than $15 billion worldwide" inside an $82 billion market and noted that sales of temperature-controlled pharma products were "growing at twice the rate of the pharma industry as a whole." Older numbers, but a long-running series with a consistent method.
What it means: the industry is building cold rooms and buying reefers faster than it is building visibility between them. Capacity is a solved problem you can buy. The handoff between two pieces of capacity is not.
Pharma Cold Chain Losses: Tracing the $35 Billion Figure
If you have read anything about pharma cold chain logistics, you have read that the industry loses $35 billion a year to temperature failures. We use the figure ourselves, so we went looking for where it comes from. A number this large deserves a footnote.
The trail leads to July 2019. Peli BioThermal's 2019 Biopharma Cold Chain Logistics Survey circulated the estimate with attribution to the IQVIA Institute for Human Data Science; Air Cargo News reported it that month as a figure "quoted in the 2019 Biopharma Cold Chain Logistics Survey" that "includes lost product, clinical trial loss and replacement costs, as well as wasted logistics costs and the costs of root-cause analysis." The trade press has repeated it since: the Indianapolis Business Journal in 2023 ("$35 billion annually, according to the IQVIA Institute for Human Data Science"), Manufacturing Chemist in 2024. SupplyChainBrain's 2022 column on "the $35 billion challenge" links the number straight to the Peli survey report.
Three caveats. The underlying IQVIA analysis is not public; every citation we found points to a vendor survey or a trade article. The number is global and covers biopharma broadly, so it should not be applied to any one company's shipments. And as far as we can find it has not been updated since 2019, while biologics spending has grown sharply. Treat $35 billion as an order of magnitude, sourced to IQVIA via Peli BioThermal (2019).
Why the exposure keeps growing: biologics, most of them temperature sensitive, "now comprise 46% of total medicine spending" in the United States as of 2021 after growing 12.5% a year for five years, per the IQVIA Institute, and IATA notes the pharmaceutical industry moves "over one trillion dollars worth of cargo every year." More of a bigger pie needs to stay cold.
How Often Do Excursions Happen?
This is the question with the weakest public data. The best-known survey, Peli BioThermal's 2019 poll of biopharma "key opinion leaders," found 44.6% of respondents reporting "multiple temperature excursions per year" and 16% a monthly occurrence, as Air Cargo News reported it. Statista, which holds the chart behind a paywall, notes the source gives no sample size or method, so treat those shares as one vendor's poll.
What the regulators say is more useful. WHO defines a temperature excursion as "an excursion event in which a TTSPP is exposed to temperatures outside the range(s) prescribed for storage and/or transport," and CDC measures it as how long a unit has been "operating outside the recommended temperature range." CDC's metric counts minutes, not shipments. For the story of what these failures cost, read The $35 Billion Secret Your Pharmacist Doesn't Know About.
Treat $35 billion as an order of magnitude with a footnote, not a fact with a decimal.
Vaccine Wastage: What WHO and UNICEF Report
Vaccines are the cold chain's oldest and most studied cargo, and the loss figures are stark.
The headline number is WHO's, and it is almost always quoted secondhand. The primary text is WHO's 2005 guidance Monitoring vaccine wastage at country level, which opens: "The World Health Organization reports over 50% vaccine wastage around the world," with no derivation. UNEP's 2020 summary softened it to "up to 50% of vaccines are wasted globally every year, a large part because of lack of temperature control and the logistics to support an unbroken cold-chain," and did the pandemic arithmetic: at that rate COVID-19 "could waste potentially a billion vaccines."
A second WHO figure travels the same way. A 2022 study in Tropical Diseases, Travel Medicine and Vaccines cites WHO's 2009 State of the World's Vaccines and Immunization for the statement "that as much as 25% of all vaccine products reach their destination in a degraded state"; in that study 46.2% of the Ethiopian health facilities audited showed poor adherence to WHO storage codes. UNICEF supplies vaccines to 109 countries a year and reaches 45% of the world's children under five. In the United States, CDC sets the storage windows: 2°C to 8°C refrigerated, -50°C to -15°C frozen, -90°C to -60°C ultra-cold.
What it means: WHO's wastage figure counts every cause, including doses discarded from opened multi-dose vials, so it is not a pure cold chain number. WHO attributes wastage in unopened vials "usually" to "cold chain and stock management problems," which makes it a handling and monitoring problem as much as an equipment one.
Food Loss and Waste in the Cold Chain
Food is the larger half of the cold chain and of its losses, and it is measured far better than pharma because the UN agencies have been counting for a decade.
The Global Picture
FAO's Food Loss Index finds "the percentage of food lost globally after harvest on farm, transport, storage, wholesale and processing levels is estimated at 13.3 percent in 2023, up slightly from 13.0 percent in 2015." Waste, the downstream half, is UNEP's Food Waste Index: 1.05 billion tonnes in 2022, "almost one-fifth of all food available to consumers," 132 kilograms per person, split 60% households, 28% food service and 12% retail; food loss and waste together cost the global economy "roughly USD 1 trillion." UNEP's cold chain report sums it up: "an estimated 14 percent of the total food produced for human consumption is lost, while 17 per cent is wasted."
The refrigeration-specific number matters most here. UNEP and FAO's 2022 report found that "lack of effective refrigeration directly results in the loss of 526 million tons of food production, or 12 per cent of the global total," and that developing countries could save 144 million tonnes a year with developed-country cold chains. That lost food produced about 1 gigatonne of CO2 equivalent in 2017, about 2% of global emissions; the food cold chain as a whole accounts for about 4%.
The United States
USDA's Economic Research Service set the U.S. baseline: in 2010, 31 percent of the available food supply at the retail and consumer levels, 133 billion of 430 billion pounds, went uneaten, worth $161.6 billion at retail prices, split 10% at retail and 21% at the consumer level. ReFED's modeling, which covers the full chain from farm to home, counts 70 million tons of surplus food in 2024, about 29% of the U.S. food supply and worth $380 billion, of which 85% ($325 billion) was wasted. That was a 2.2% drop from 2023, the first meaningful decline since the pandemic.
Why U.S. food becomes surplus: share of 2024 surplus food by cause
Read the causes with a cold chain eye. Spoilage is 12.9% of surplus, roughly 9 million tons, and buyer rejections, food safety holds, and mistakes and malfunctions add another 6.2%. Those four categories are where temperature history decides the outcome, and together they are about one fifth of everything unsold or uneaten. By food type, produce is 45.4% of surplus, dairy and eggs 12.7%, fresh meat and seafood 5.2%, and frozen food just 1.3%. Frozen food does not forgive a thaw, but it tolerates a dock. Chilled food tolerates neither.
By sector, farms generate 24.2% of surplus, manufacturing 18.8%, food service 17.9%, retail 5.7% and households 33.5%. Surplus food in 2024 produced greenhouse gas emissions equal to 3.5% of the U.S. total, and just under 13% of donatable surplus was donated.
What it means: in food, the cold chain's failure mode is rarely dramatic. It is a pallet of strawberries that arrives two days older than its paperwork says, gets marked down, and ends up in the 12.9%. Nobody files a claim for a markdown.
Where Excursions Happen: Handoffs, Hubs and Docks
Ask anyone who has run a cold chain where it breaks and they will say: at the seams. The reefer is cold. The warehouse is cold. The 45 minutes between them is not. Independent data on what share of excursions occur at handoffs is thin and mostly vendor-published, so there is no statistic card here. What we can show is that the regulators, who read the deviation reports, all point at the same place.
- EU GDP Names the Hub "Where the transportation route includes unloading and reloading or transit storage at a transportation hub, particular attention should be paid to temperature monitoring, cleanliness and the security of any intermediate storage facilities," and temporary storage should be kept as short as possible.
- WHO Names the Apron and the Customs Queue TRS 961 Annex 9 wants shipments moved "as soon as possible after arrival" from "the wharf or airport apron" to temperature-controlled storage, and clearance arranged "to avoid delays during customs clearance that may cause temperature excursions."
- FDA Names the Loading Operation The Sanitary Transportation rule makes the shipper specify an operating temperature in writing, and on request the carrier must "demonstrate that it has maintained temperature conditions during the transportation operation." The dock is where control changes hands.
- CDC Names the Minutes Its excursion metric is "how long a unit has been operating outside the recommended temperature range." A thermometer at the destination says the product is warm. It cannot say when it got that way.
The data we do have agrees: in ReFED's U.S. figures the chilled categories are more than 63% of surplus food while frozen is 1.3%, and chilled product has the least shelf life to spend at each handoff. Your Wine Survived Years in a Barrel shows how a tarmac turns a mild day into a cooked pallet.
Why It Matters
If your monitoring lives in the room and the truck, it lives everywhere except where the losses happen. The only asset that crosses the seam with the product is the pallet.
Monitoring Adoption and What the Rules Now Expect
Cold chain monitoring used to be a best practice. It is now a documented regulatory expectation in every major market, and the specifications are concrete enough to audit against.
| Authority | Monitoring expectation | Retention |
|---|---|---|
| CDC, Vaccine Storage and Handling Toolkit (2024) | Digital data logger on every unit; calibration testing every 2 to 3 years | 3 years |
| WHO TRS 961 Annex 9 (2011) | Record at least twice daily, preferably continuously; rooms logged six times per hour; monthly review | 1 year past end of shelf life |
| EU GDP 2013/C 343/01 | Calibrated equipment traceable to a national standard; alarms; seasonal mapping; evidence to customers on request | At least 5 years, or longer under national law |
| 21 CFR 205.50 (U.S. wholesale drug distributors) | Temperature and humidity recording equipment, devices and/or logs | 3 years for distribution records; none set for logs |
| FDA Sanitary Transportation rule (2016) | Shipper specifies operating temperature in writing; carrier demonstrates it was held, on request | 12 months |
| FSMA 204 Food Traceability Rule | Key Data Elements per Critical Tracking Event; sortable spreadsheet within 24 hours | 2 years |
Adoption is harder to measure than requirement, and the public numbers are old or partial. Pharmaceutical Commerce put "specialized tertiary packaging and instrumentation," where data loggers sit, at $4.4 billion of $15 billion in pharma cold chain logistics spending in 2018, up from $3 billion of $12.6 billion in 2016. UNEP and FAO's 144 million tonnes of avoidable loss measures how much of the world still has no cold chain to monitor.
Measured results from monitoring programs are mostly published by the companies selling them, so we left those out. What the primary sources show is the gap the rules are closing, and we have been candid about what passive RFID sees inside it: a dock-door read is a timestamp, not a temperature.
What it means: the standard of evidence has moved to continuous, calibrated and gap-free. The equipment in most networks has not.
What the Numbers Mean for the Pallet Layer
The whole post in four lines. The market is large and growing at double digits. The losses are large, concentrated in chilled product, and poorly measured where they occur. The regulators have converged on continuous, calibrated, gap-free evidence. And the equipment that generates it stops at the edge of the room and the edge of the truck.
The pallet does not stop. It rides under the same product from the outbound dock to the trailer, the cross-dock, the apron and the receiving dock. That is why we built Smart Pallets the way we did: 100% recycled HDPE that needs no ISPM 15 treatment and washes down between loads, with an embedded sensor module carrying cellular GPS, temperature, humidity and shock, built in rather than bolted on, with no scanning, no dock readers and no carrier cooperation.
Pulse, our platform, runs exception-based reporting: quiet when the pallet sits in a qualified cold room, awake the moment it moves or a threshold is crossed, logging a timestamped, geolocated event and routing it to the person who can still act. The silence is data too. Three days with no alerts is three days in spec, the record EU GDP, WHO and CDC describe, and dwell time by facility and lane shows which dock is the 45-minute seam.
- For Pharma Shippers A continuous, gap-free temperature and custody record across handoffs, the evidence GDP asks for at every hub.
- For Food Shippers A time-and-temperature history for the chilled categories that make up most of the surplus, so a markdown becomes a claim with evidence or a lane you fix.
- For Everyone An all-inclusive monthly lease designed to price at or below what you pay for wood pallets today, with pallet, sensors and exception reporting in one flat cost.
The cold chain spends hundreds of billions keeping rooms and trailers cold and then loses product in the gaps between them. The gap has a floor, and the floor can finally talk. Send us your lanes, volumes and compliance regime, and an APS expert will scope a program to your operation. Let's Talk.
Sources
- Global Market Insights, “Cold Chain Logistics Market Size, Share and Forecast,” 2026
- Global Cold Chain Alliance, “GCCA Releases Annual List of World's Largest Temperature-Controlled Warehousing and Logistics Members,” 2024
- FleetOwner, “GCCA releases 2025 Global Top 25 list of refrigerated warehouses,” 2025
- Pharmaceutical Commerce, “Biopharma Cold Chain Market Forecast” (Biopharma Cold Chain Sourcebook, 9th edition), 2018
- International Institute of Refrigeration, “The bio-pharma cold chain” (summary of the 2016 Biopharma Cold Chain Sourcebook), 2016
- Air Cargo News, “Failures in temperature-controlled logistics cost biopharma industry billions,” July 26, 2019 (archived copy)
- Manufacturing Chemist, “Ensuring temperature-sensitive goods reach their destination unspoiled,” 2024
- Indianapolis Business Journal, “Paxafe strives to predict failures in supply chain,” 2023
- SupplyChainBrain, “The $35 Billion Challenge: Using Supply Chain Intelligence to Improve Pharma Operations,” 2022
- Statista, “How frequently do your organization's shipments experience temperature excursions?” (Peli BioThermal survey), 2019
- IQVIA Institute, “Biosimilars in the United States 2023-2027,” 2023
- IATA, “Pharma and Healthcare Products” (cargo program page), 2026
- UNEP, “Why optimized cold-chains could save a billion COVID vaccines,” 2020
- World Health Organization, “Monitoring vaccine wastage at country level,” WHO/V&B/03.18 Rev.1, 2005
- Tropical Diseases, Travel Medicine and Vaccines, “Adherence to WHO vaccine storage codes and vaccine cold chain management practices at primary healthcare facilities in Dalocha District,” 2022
- UNICEF Supply Division, “Vaccines,” 2026
- CDC, “Vaccine Storage and Handling Toolkit,” March 2024
- FAO, “SDG Indicator 12.3.1(a): Global Food Loss Index,” 2025
- UNEP, “World squanders over 1 billion meals a day” (Food Waste Index Report 2024), 2024
- UNEP and FAO, “Amid Food and Climate Crises, Investing in Sustainable Food Cold Chains Crucial,” 2022
- UNEP, “Sustainable Food Cold Chains: Opportunities, Challenges and the Way Forward,” 2022
- USDA Economic Research Service, “The Estimated Amount, Value, and Calories of Postharvest Food Losses at the Retail and Consumer Levels in the United States,” EIB-121, 2014
- ReFED, “Progress on the Plate: 2026 U.S. Food Waste Report,” 2026
- European Commission, “Guidelines of 5 November 2013 on Good Distribution Practice of medicinal products for human use,” OJ C 343/1, 2013
- World Health Organization, “Model guidance for the storage and transport of time- and temperature-sensitive pharmaceutical products,” TRS 961 Annex 9, 2011
- 21 CFR 205.50, Minimum requirements for the storage and handling of prescription drugs (Cornell LII)
- U.S. FDA, “FSMA Final Rule on Sanitary Transportation of Human and Animal Food,” 2016
- 21 CFR 1.908, Requirements applicable to shippers, loaders, receivers and carriers (Cornell LII)
- 21 CFR 1.912, Records retention (Cornell LII)
- 21 CFR 1.1455, Food traceability records: availability and retention (Cornell LII)
FAQ
What Is Cold Chain Logistics?
Cold chain logistics is the storage and transport of temperature-sensitive goods inside controlled conditions from origin to point of use. WHO defines temperature-controlled as "any environment in which the temperature is actively or passively controlled at a level different from that of the surrounding environment within precise predefined limits."
How Big Is the Cold Chain Logistics Market?
Global Market Insights values the market at $382.3 billion in 2025 and $429.1 billion in 2026, projecting $1.37 trillion by 2035 at a 13.8% compound annual growth rate. Food and beverage is the larger application and pharmaceuticals and healthcare the faster growing.
What Counts as a Temperature Excursion?
WHO defines it as "an excursion event in which a TTSPP is exposed to temperatures outside the range(s) prescribed for storage and/or transport." CDC measures it as the time a unit spends "operating outside the recommended temperature range," which is why it recommends digital data loggers that record duration.
Where Does the $35 Billion Pharma Cold Chain Figure Come From?
It is an IQVIA Institute for Human Data Science estimate of annual biopharma losses from failures in temperature-controlled logistics, circulated in 2019 with Peli BioThermal's Biopharma Cold Chain Logistics Survey and repeated by trade press since. The underlying analysis is not public and, as far as we can find, has not been updated, so treat it as a global order of magnitude.
How Much Food Is Lost for Lack of Refrigeration?
UNEP and FAO estimate that lack of effective refrigeration directly results in the loss of 526 million tonnes of food a year, 12% of global production, and that developing countries could save 144 million tonnes annually by matching developed-country cold chain coverage. FAO's Food Loss Index puts 13.3% of food lost between harvest and retail in 2023.
Featured Posts From the APS Blog

The $35 Billion Secret Your Pharmacist Doesn't Know About
A vial of insulin leaves Chicago produced to an exacting specification and stored at the right temperature. What happens next is a $35 billion problem.
 Rodrigo CastroCo-Founder & President7 min read
Your Wine Survived Years in a Barrel. It Didn't Survive Two Days on a Truck
Over $1 billion of alcohol is damaged in transit every year, and the bottles arrive looking fine. That is the problem.
Rodrigo CastroCo-Founder & President6 min read
Pallets, Paperwork, and Proof: How Two of the Least Sexy Industries Finally Found Each Other
Incoterms decide the exact point where risk transfers from seller to buyer. Almost nobody has the data to enforce what they are supposed to guarantee.
Rodrigo CastroCo-Founder & President6 min read