
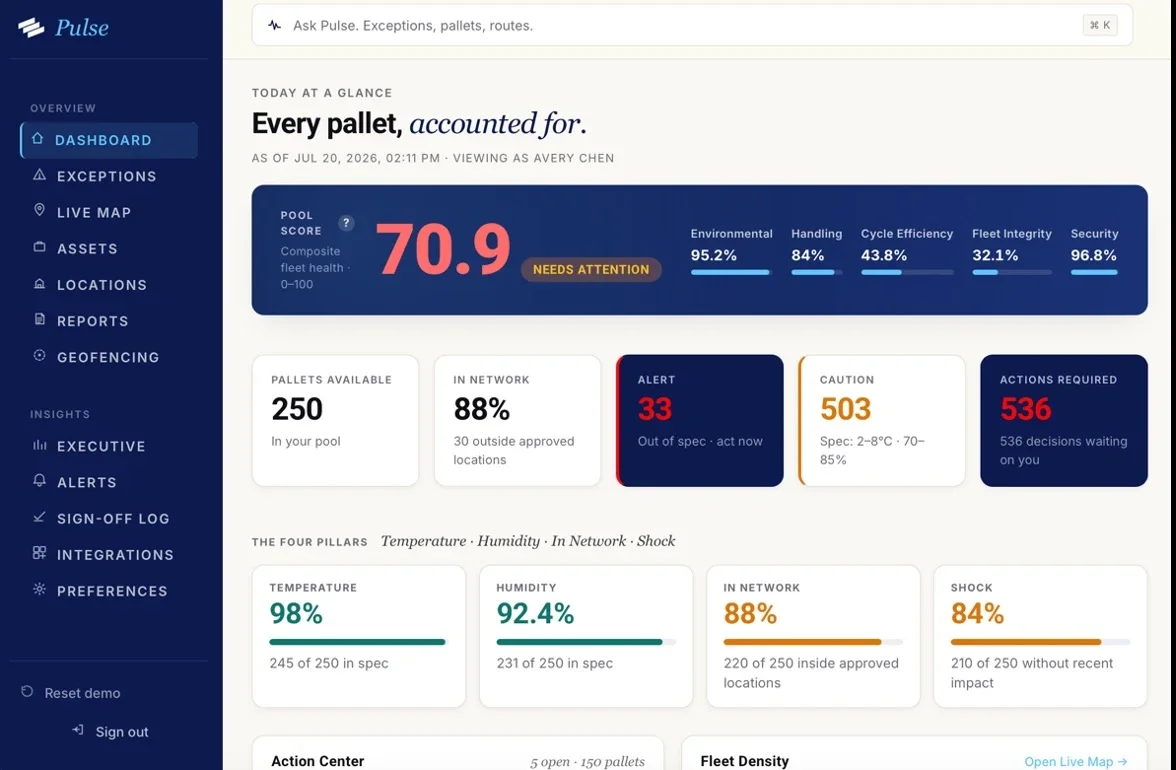
Picture a lane manager who gets about 4,000 location pings a day from the trackers on her reefer trailers. She has a map. The map is green. She still cannot say, when a retailer deducts for a late and short delivery, whether the load sat at the shipper's dock for three hours or the receiver's for five, or whether the pallets were warm when they left. The pings describe motion. Nobody has asked them a question.
That is the difference between supply chain data and supply chain intelligence. Data is what the network emits. Intelligence is a decision made sooner because of it, by a person told at the right time, with a record that holds up afterward. Most companies have far more of the first than the second, and the fix is not more data. It is a chain that turns a signal into an exception and an exception into an action, with the noise removed in between.
This guide builds that chain from one data stream, the one we know best: the pallet. We cover the signal-to-decision chain, the KPIs pallet data feeds, three worked examples, multi-tier visibility, predictive analytics done honestly, digital twins, and how to start with a pilot that proves something. We explain exception-based reporting carefully, because it is the core of how we built Pulse.
Key Takeaways
- Supply chain intelligence is a chain, not a dashboard: signal, event, exception, decision, action. Most programs stop at the first two.
- One stream of pallet data feeds the KPIs operators already answer for: dwell time, OTIF, asset turns, loss and shrink, excursion rate, claim win rate and detention.
- The money is real: ATRI measured $3.6 billion in direct expenses and $11.5 billion in lost productivity from driver detention in 2023, with fewer than half of detention invoices paid.
- Visibility is still shallow: in McKinsey's 2025 pulse of 100 companies, 95% could see tier-one supplier risk but only 42% could see tier two or beyond.
- Exception-based reporting is the whole idea: a pallet that is quiet when conditions are normal and specific when they are not produces fewer records and more decisions.
The Supply Chain Intelligence Chain: Signal, Event, Exception, Decision, Action
Supply chain visibility and analytics programs are judged by how much they can show. Intelligence is judged by how little a person has to look at before they know what to do. Getting from one to the other means passing every signal through five stages and being ruthless about what survives each one.
| Stage | What It Is | Pallet Example | Who Cares |
|---|---|---|---|
| Signal | A raw reading | GPS fix, 6.1°C, 2.3 g shock | Nobody, yet |
| Event | A signal read in context | Departed shipper 14:02; arrived cross-dock 19:40 | The record |
| Exception | An event that breaks a rule set in advance | Above 8°C for 45 minutes; dwell past 6 hours | One named owner |
| Decision | The owner's choice, with evidence in hand | Reject the load, call the carrier, file the claim | The business |
| Action | The decision executed and logged | Claim filed with timestamps; lane moved | Everyone, next quarter |
The third stage separates a visibility program from an intelligence program. Signals and events are cheap and infinite. Exceptions are scarce by design, defined by rules you wrote before the data arrived: what temperature band, for how long, what dwell threshold at which facility, which route deviations matter. An exception nobody defined in advance is just an interesting chart.
Exception-Based Reporting, Explained Properly
Here is how the pallets we build behave. When a pallet is stationary and conditions are inside the band, the system is quiet. It is not failing to report; it is reporting that nothing needs attention, which is itself a record. When the pallet moves, when temperature or humidity crosses a threshold, when a shock exceeds the limit, or when the load state changes, the sensor wakes up and logs exactly what happened, timestamped and geolocated. Pulse matches the event against the rules and routes any exception to the one person who can act, on the channel they already use.
Think of it as a smoke detector rather than a security camera. A camera gives you forty hours of footage to review after the fire. A smoke detector gives you one loud signal while there is still time to act. And a quiet pallet during three days at a distribution center is not missing data; it is evidence that conditions held, decisive the moment an exception fires on the next movement. We wrote about that in Pallets, Paperwork, and Proof: the silence is data too.
Key Takeaway
Define exceptions before the first device ships: temperature band and duration, dwell thresholds by facility, allowed routes, shock limits by product. Then name an owner for each. A program with rules and owners produces decisions. One without them produces a very green map.
The Supply Chain KPIs One Pallet Data Stream Can Feed
Pallet data does not require new KPIs. It feeds the ones a VP of supply chain is already measured on, with primary-source evidence instead of carrier-reported numbers.
| KPI | What the Pallet Contributes | Decision It Unlocks |
|---|---|---|
| Dwell time by facility and lane | Arrival and departure timestamps at every stop, including ones you do not operate | Which docks and lanes eat your hours |
| OTIF (on time, in full) | Independent arrival time and load-state change at the receiver | Dispute deductions with evidence |
| Asset turns | Issue-to-return cycle time per pallet, by customer | Right-size the fleet |
| Loss and shrink rate | Last known location of every pallet; load changes in transit | Recover assets; find where product disappears |
| Excursion rate | Temperature, humidity and shock events against the product's band | Reject, quarantine or release on a record |
| Claim win rate | Departure condition, exception, arrival condition, all timestamped | File fewer, stronger claims |
| Detention | Minutes at the facility versus contract free time | Bill and defend detention; fix the facilities |
Why Dwell Time Comes First
If you instrument one thing first, instrument dwell. It has the most money attached and the least independent data behind it. The American Transportation Research Institute's September 2024 study found drivers were detained in 39.3 percent of all stops in 2023, 56.2 percent for refrigerated trailers; time lost in for-hire trucking exceeded 135 million hours; the industry absorbed $3.6 billion in direct expenses and $11.5 billion in lost productivity. And although 94.5 percent of fleets charge detention fees, they are paid on fewer than half of those invoices, because the shipper's clock and the carrier's clock disagree.
Detention is also a safety number. The U.S. Department of Transportation's Office of Inspector General estimated in 2018 that each 15-minute increase in average dwell time raises the expected crash rate by 6.2 percent, and that detention cuts for-hire truckload drivers' earnings by $1.1 billion to $1.3 billion a year. The OIG also said plainly that accurate industrywide detention data did not exist, because electronic data cannot separate detention from legitimate loading. A pallet that logs when it stopped and when it moved again is that missing clock.
OTIF, Shrink and Excursions
The other KPIs carry their own price tags. Walmart's 2020 change to its on-time, in-full program required suppliers and carriers to deliver by their must-arrive-by dates 98 percent of the time or be fined 3 percent of the cost of the goods. A supplier that cannot prove when its pallets arrived, and in what state, pays the deduction. The National Retail Federation's 2023 security survey put the average retail shrink rate at 1.6 percent of sales in fiscal 2022, or $112.1 billion. Pharmaceutical Commerce reported in 2026 that temperature failures cost pharma an estimated $35 billion a year, and FreightWaves cited estimates that 20 percent of temperature-sensitive products are damaged in shipment. Every one of those is a KPI measured today after the loss. Pallet data measures it while the pallet is still on the truck.
Three Worked Examples: A Lane, a DC and a Claim
The scenarios below are illustrative; the thresholds and decisions are the kind operators set.
Example One: A Lane With Rising Dwell
A consumer goods shipper runs a lane from Ohio to a retailer's DC in Georgia. Pallet timestamps show the median stop at the receiving dock has crept from 2.1 hours in March to 4.8 in June, while the shipper-side dock is flat at 1.4. Detention invoices have doubled and the retailer is disputing them. Before pallet data, this is an argument. With it, the exception rule (dwell beyond 4 hours at any receiver) has fired 22 times in four weeks, all at the same facility, between 6 a.m. and 9 a.m.
The decision is now specific. The logistics director takes the 22 records to the retailer's DC manager, who finds a shift-change gap on inbound. Appointment windows move, the detention invoices are paid on the strength of a third clock neither party controls, and in this scenario the next quarter's median drops to 2.4 hours. One rule, one owner, one conversation.
Example Two: Six Days Versus Two
A food distributor runs two regional DCs on the same pallet fleet. DC West issues and recovers a pallet in about two days. DC East takes six. For years this showed up only as a monthly pallet shortage at East, solved by buying or renting more. With timestamps per pallet, the gap is visible by customer: three East customers hold pallets for twelve days or more, and a fourth has 140 pallets in a yard that have not moved in three weeks. The silence of those 140 pallets is the finding.
Decisions follow in order of ease. Recover the 140. Put the three slow customers on a return schedule, with the data to show them why. Then resize: East needs turns closer to West's, not 30 percent more pallets. Pallets bought to cover a visibility gap are exactly the hidden operational cost our Savings calculators are built to surface.
Example Three: A Claim Settled by a Timestamp
A pallet of chilled product arrives out of spec. The receiver says it arrived that way; the carrier says it was fine at pickup; the shipper says it left cold. The claimant has a limited window to file and must show the goods were tendered in good condition and delivered damaged. Without data, this is the dispute written off because the fight costs more than the load.
With pallet data there are three records. Departure: 3.9°C, stable for 30 hours in the shipper's cooler, no alerts. Exception: temperature crossed 8°C at 02:14 at a location matching a truck stop 180 miles from the destination, and stayed above it for 3 hours 50 minutes. Arrival: 11.2°C at the receiver's dock. Three timestamps settle where and when the damage occurred and who had custody. The claim is filed the same day with the record attached. The same three records, across a quarter's worth of claims, move claim win rate from a lottery to a KPI.
Why It Matters
In all three examples the data volume was small and the decision was large. That is the signature of supply chain intelligence: a few exceptions, each with a timestamp, a location and an owner, replacing a quarter's worth of arguments.
Multi-Tier Supply Chain Visibility and the Inventory Problem
Multi-tier supply chain visibility usually means knowing your suppliers' suppliers, and the surveys say the industry is still shallow. In McKinsey's 2025 supply chain risk pulse of 100 companies, 95 percent of respondents had visibility into at least tier-one supplier risks, but only 42 percent could see tier two or beyond. The Business Continuity Institute's 2024 Supply Chain Resilience Report found 17.1 percent of organizations analyze critical suppliers down to tier four and beyond, up from 3.7 percent the year before.
There is a second meaning of multi-tier that matters more to a logistics leader, and it is physical: the product passes through tiers of custody. Your plant, a carrier, a cross-dock you do not operate, a 3PL, a retailer's DC. Each handoff is a tier, and traditional inventory visibility in the supply chain stops at the edge of the systems you own. Your WMS knows the pallet left; the retailer's knows it arrived; the 36 hours between are a tier nobody records.
This is where the pallet earns its place. A sensor embedded in the pallet does not care whose building it is in. It reports location and condition across every tier of custody without a dock reader, a login to someone else's system, or the carrier's cooperation. The data is yours because the asset is yours. That is the practical answer to multi-tier visibility for goods in motion.
Inventory Visibility and the Accuracy Problem
Inventory visibility inside the four walls has its own data problem. GS1 US and Auburn University's RFID Lab ran a ten-month study, Project Zipper, across eight brands and five retailers, and found audits on legacy barcode data recorded an order inaccuracy 69 percent of the time, against less than 0.01 percent with RFID. That is why APS pallets carry RFID tags alongside the embedded cellular hardware. In-DC scanning is what RFID does well, and our post on what RFID pallet tracking actually tells you is honest about where it stops: the dock door. Intelligence needs the scan inside and the signal outside.
Supply Chain Visibility and Predictive Analytics, Done Honestly
Predictive analytics is the most over-promised phrase in supply chain technology, so let us be exact about what pallet data can and cannot predict. It cannot predict demand, a port strike or a tariff. It can predict, with growing confidence as the record grows, which lanes and facilities will produce the next dwell exception, which carriers will produce the next excursion, and which customers will produce the next pallet shortage. Those predictions rest on a track record of the same asset on the same lane, the only kind an operator should trust.
The industry wants this badly. The 2025 MHI Annual Industry Report, produced with Deloitte from more than 700 supply chain leaders, projects predictive analytics adoption reaching 87 percent within five years. McKinsey's 2024 survey of 88 global supply chain leaders found 90 percent saying their companies lack the talent to meet their digitization goals, and McKinsey slides from the same survey, reproduced by Georgia Tech's Supply Chain and Logistics Institute, put the share investing in real-time early warning systems at only 33 percent. BCG's October 2024 study of 1,000 executives found only 26 percent of companies able to get tangible value from AI at all.
The honest reading is that prediction fails for want of two things: clean, continuous data about the physical world, and simple rules people trust. Gartner puts the average cost of poor data quality at $12.9 million a year per organization. The way to avoid being that organization is to earn prediction in stages:
- Baseline First Measure median and 90th-percentile dwell, excursion rate and turn time per lane and facility for a quarter before predicting anything. A prediction without a baseline is a guess with a confidence interval.
- Rules Before Models Simple thresholds (dwell over 4 hours at receiver X, above 8°C for 30 minutes) catch most of the value and are explainable to a carrier or a retailer. Models come later, when the rules stop surprising you.
- Predict Exceptions, Not Outcomes Flag the lane whose dwell has risen three weeks running, or the carrier whose excursion rate doubled, before the next load ships. That is a forecast an operator can act on.
- Measure the Prediction Track how many flagged lanes actually produced exceptions. Retire predictions that do not beat the baseline. This is the discipline most predictive supply chain analytics programs skip.
One reading is a data point. A thousand on the same lane are a track record, the only forecast worth acting on.
The Supply Chain Digital Twin, and What Feeds It
A supply chain digital twin is a model of your network, nodes, lanes, inventory and flows, kept synchronized with reality closely enough to simulate a change before you make it. What if we close DC East, or move this lane to a second carrier? Gartner found in a January 2023 survey of 380 supply chain leaders that 60 percent were piloting or planning one.
The useful question is what keeps the twin synchronized. A twin fed by ERP and WMS transactions knows what people recorded. A twin fed by TMS data knows what carriers reported. Neither knows that pallets sit six days at East, that the Georgia lane dwells at dawn, or that a carrier's trailers run warm on Sunday nights. Those facts make a simulation worth running, and they come from the physical layer. The twin is only as realistic as the dwell, condition and turn data underneath it, which is why we treat pallet data as its ground truth.
There is a traceability dimension too. The FDA's Food Traceability Rule under FSMA Section 204 requires covered firms to keep Key Data Elements for Critical Tracking Events and produce them to FDA within 24 hours of a request. The original compliance date was January 20, 2026; the FDA has proposed extending it to July 20, 2028, and Congress has directed the agency not to enforce the rule before then. A record of where a pallet was and when, at every handoff, is the shape of data that rule asks for, and a twin that holds it answers the regulator and the planner from one source.
Watch Out
A digital twin built before the physical layer is instrumented is calibrated to the transactions, not the trucks. Instrument first, model second.
How to Start: Pilot Design, Baselines and Governance
Intelligence programs fail at the start more often than at scale, because the pilot was designed to be interesting rather than conclusive.
Pick Lanes Where the Cost Is Already Measured
Choose two or three lanes or facilities where you are already paying a number you can name: detention invoices in dispute, OTIF deductions, a product family with recurring claims, a DC that keeps running out of pallets. The pilot's job is to move that number.
Set the Baseline Before the First Device Ships
Record the current state for a quarter if you can, a month if you cannot: median and 90th-percentile dwell by facility, claims filed and won, excursions detected, pallet turns by customer. You are measuring the technology against what you believe today.
Write the Exceptions and Name the Owners
- Condition Exceptions The temperature or humidity band per product family and how long outside it counts. Owner: quality.
- Dwell Exceptions Hours at each facility type beyond which someone is told, with contract free time as the default. Owner: transportation.
- Route and Security Exceptions Unplanned stops, lane deviations, load changes in transit. Owner: security or the lane manager, with a defined escalation.
- Asset Exceptions Pallets stationary beyond a set number of days at a customer or yard. Owner: the account manager, since it is a customer conversation.
Govern the Record Like Evidence
Decide who owns the data, who can change a threshold, how long records are retained, and how a record is pulled for a claim or an audit. On Our Technology we describe this as arguing from a record neither side can dispute; that holds only if the governance is boring and consistent.
| Pilot Checkpoint | Pass Looks Like | Fail Looks Like |
|---|---|---|
| Week 2 | Exceptions firing at the expected rate, each reaching its owner | Hundreds of alerts, no owner, default thresholds |
| Week 6 | First decision taken on an exception, logged against the event | Interesting findings in a slide deck |
| Week 12 | A baseline KPI moved on one lane; one claim or detention dispute settled on the record | Request for a bigger dashboard |
| Scale decision | A dollar figure per lane and a list of the next ten lanes | A second pilot |
Why Pallet Data Is the Right Place to Start Building Intelligence
Why the pallet first, since it is our business, and where it stops.
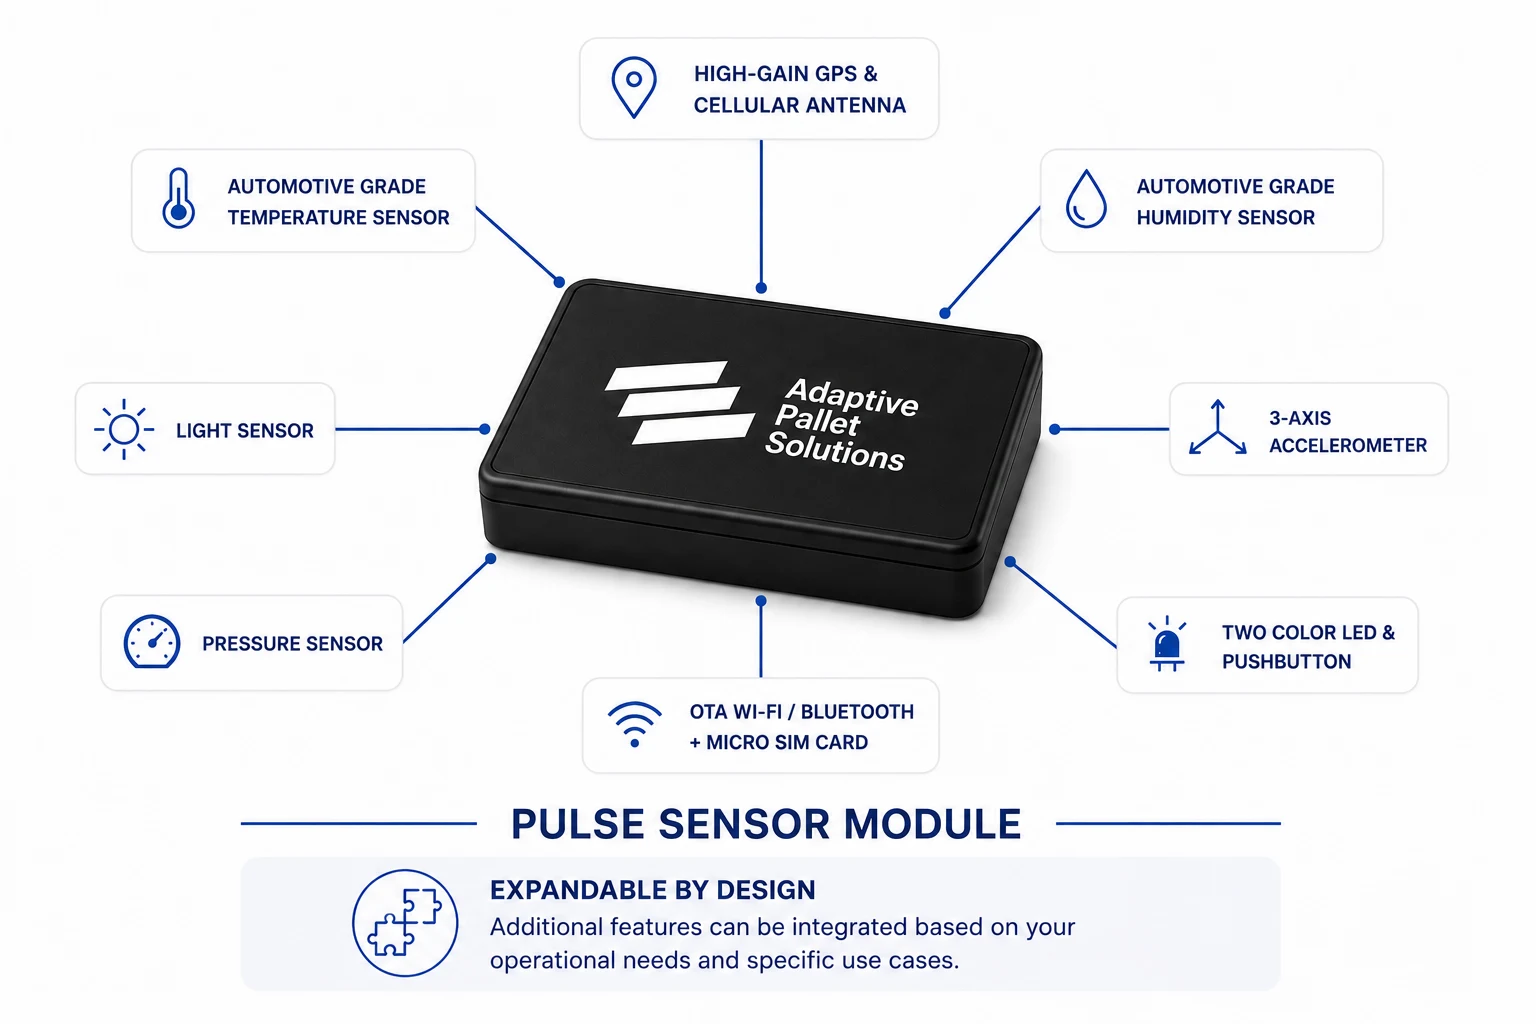
Every other source of supply chain data belongs to someone. The TMS feed belongs to the carrier, the receiving scan to the retailer, the temperature log to the reefer unit. The pallet is the one asset that is yours, physically under the product at every tier of custody, and able to carry its own sensor. APS Smart Pallets do: an embedded module, built into the pallet rather than bolted on, with cellular GPS plus temperature, humidity and shock, and room for more depending on the program. No scanning, no facility infrastructure, no carrier cooperation needed. A GPS tracker has to be attached and set up to connect; ours skips those steps. An RFID tag gives a ping at a reader; our pallets carry those tags too, for in-DC workflows.
Pulse does the intelligence part. It is built on exception-based management: you do not monitor 100,000 pallets, you see only what needs your attention, routed to the right person by push, email or SMS, and it connects to the WMS and ERP you already run. The outcomes are the three this guide has been about: visibility the instant something changes, an independent timestamped record of every handoff, and a track record per lane that turns dwell, excursions and turns into KPIs.
Where it stops: a pallet cannot tell you about a tier-three supplier's factory fire, your demand forecast or a tariff. It is one data stream. It happens to be the one that crosses every tier of custody on its own and is priced inside an all-inclusive monthly lease designed to come in at or below what you pay for wood today. The pallets are 100 percent recycled HDPE, up to 30 percent lighter than wood and dimensionally consistent to under 1 percent (see Why Plastic), and they return to our HDPE stream at end of life (see Sustainability). Intelligence at the foundation, literally.
The goal was never more data. It was faster clarity. Start at the pallet, define the exceptions, name the owners, and let the silence do some of the work.
Sources
- American Transportation Research Institute, “New Research Documents Substantial Financial and Safety Impacts from Truck Driver Detention,” September 2024
- U.S. Department of Transportation Office of Inspector General, “Estimates Show Commercial Driver Detention Increases Crash Risks and Costs, but Current Data Limit Further Analysis,” Report ST2018019, January 2018
- FreightWaves, “Walmart Tightens On-Time, In-Full Requirements,” September 2020
- National Retail Federation, “National Retail Security Survey 2023,” 2023
- Pharmaceutical Commerce, “Why Temperature Control Is Now Pharma's Make-or-Break Variable,” September 2026
- FreightWaves, “Investing in Supply Chain Visibility Can Save Billions in Pharmaceutical Logistics,” January 2020
- McKinsey & Company, “Supply Chain Risk Pulse 2025: Tariffs Reshuffle Global Trade Priorities,” December 2025
- McKinsey & Company, “Supply Chains: Still Vulnerable,” Global Supply Chain Leader Survey 2024, October 2024
- McKinsey & Company, survey of global supply chain leaders, April to June 2024 (N=88), slides as reproduced by the Georgia Tech Supply Chain and Logistics Institute, September 2024
- Business Continuity Institute, “Supply Chain Resilience Report 2024,” 2024
- GS1 US and Auburn University RFID Lab, “Project Zipper,” as reported by Retail Dive, October 2018
- MHI and Deloitte, “2025 MHI Annual Industry Report: The Digital Supply Chain Ecosystem,” as released March 20, 2025 (Intelligent CIO)
- BCG, “AI Adoption in 2024: 74% of Companies Struggle to Achieve and Scale Value,” October 24, 2024
- Gartner, “How to Improve Your Data Quality,” Smarter With Gartner, July 2021 (also cited by Boomi, 2023)
- Gartner, “Gartner Survey Shows Just 27% of Chief Supply Chain Officers Plan to Implement a Digital Twin of the Customer,” press release, July 20, 2023 (also reported by Material Handling & Logistics)
- U.S. Food and Drug Administration, “FSMA Final Rule on Requirements for Additional Traceability Records for Certain Foods” (compliance date status), 2026
FAQ
What Is Supply Chain Intelligence?
Supply chain intelligence is the practice of turning raw supply chain data into timely decisions: signals become events, events are tested against rules to become exceptions, exceptions go to a named owner, and the action is logged against the record. It differs from visibility by producing fewer records and more decisions.
What Is Dwell Time in Logistics and Why Does It Matter?
Dwell time is how long a truck, trailer or pallet sits at a facility between arrival and departure. It drives detention cost, delivery reliability and asset turns. ATRI found drivers were detained in 39.3 percent of stops in 2023, costing the industry $3.6 billion in direct expenses and $11.5 billion in lost productivity, with fewer than half of detention invoices paid.
Which Supply Chain KPIs Can Pallet Data Improve?
Dwell time by facility and lane, on-time in-full performance, asset turns, loss and shrink rate, excursion rate, claim win rate and detention. All seven are fed by the same readings (location, time, temperature, humidity, shock, load state and route) logged as timestamped events by a sensor embedded in the pallet.
What Is Exception-Based Reporting in a Supply Chain?
Exception-based reporting means the system stays quiet when conditions are inside the band you defined and reports only when a rule is broken: a temperature excursion, a dwell past threshold, an unplanned stop, a pallet that has not moved in weeks. It cuts data volume, speeds decisions, and treats a quiet period as evidence that conditions held.
What Is the Value of Supply Chain Visibility if We Already Have Tracking?
Tracking tells you where a truck is. Visibility with analytics tells you what is off plan, who owns it, and what it is costing, backed by a record independent of the carrier or the receiver. The value shows up in paid detention invoices, won claims, fewer OTIF deductions, recovered pallets and smaller fleets. The test is whether a KPI moved.
Featured Posts From the APS Blog
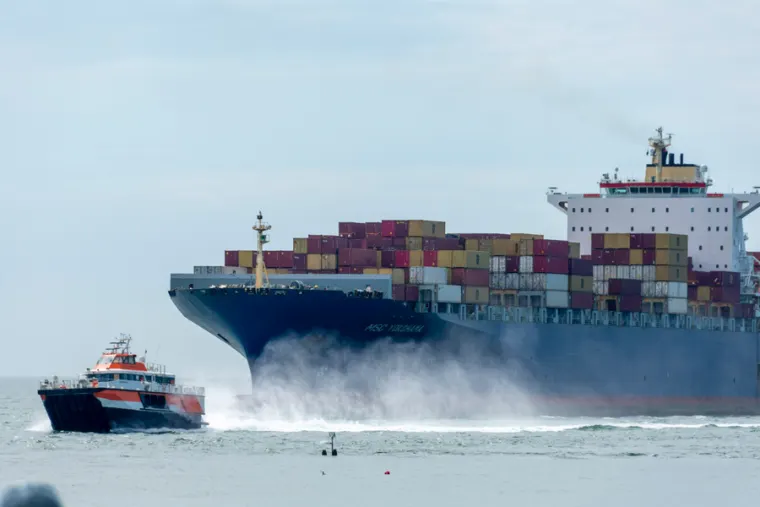
Pallets, Paperwork, and Proof: How Two of the Least Sexy Industries Finally Found Each Other
Incoterms decide the exact point where risk transfers from seller to buyer. Almost nobody has the data to enforce what they are supposed to guarantee.
 Rodrigo CastroCo-Founder & President6 min read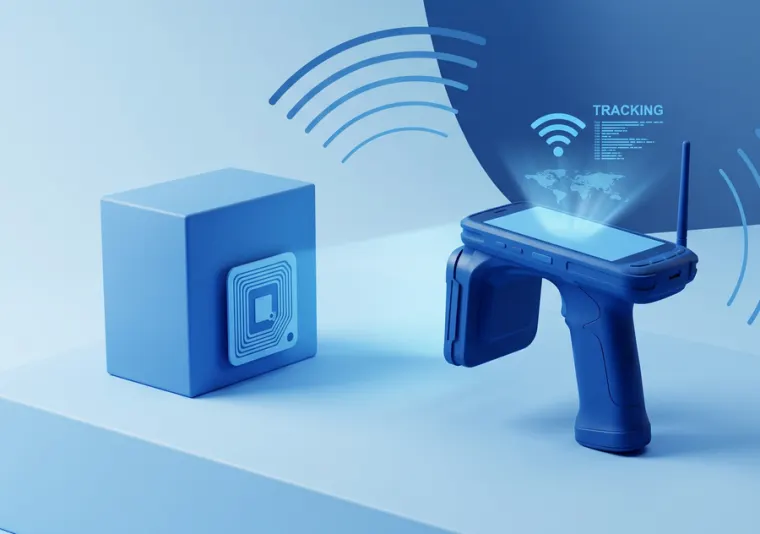
What RFID Pallet Tracking Actually Tells You (And What It Doesn't)
What gets packaged and sold as smart pallet technology is, in most cases, a ten-cent sticker on a rickety wooden pallet. Here is what passive RFID can and cannot see.
Rodrigo CastroCo-Founder & President5 min read
The Pallet Is Costing You More Than You Think
You have invested millions in automation and you track labor, freight and energy to the decimal. Somewhere on your dock, a wooden pallet is about to stop the line.
Rodrigo CastroCo-Founder & President10 min read