
Supply Chain Visibility Statistics Every Logistics Leader Should Know
Sixty percent of supply chain leaders can see their tier-one suppliers clearly. Almost 80 percent were disrupted in the past year. Here is what the surveys actually show about how much visibility companies have, what the gaps cost, and where the data stops.
Key findings
- Visibility stops early: 60 percent of leaders see their tier-one suppliers comprehensively, deeper-tier visibility fell 7 points in 2024 (McKinsey), and only 13 percent can map their entire chain (Deloitte and CIPS).
- Disruption is routine: almost 80 percent of organizations were disrupted in the past 12 months (BCI), Resilinc logged 22,522 disruption alerts in 2024, up 38 percent, and McKinsey Global Institute expects a month-long disruption every 3.7 years.
- The bill is large: companies lose an average of $182 million a year in revenue to disruptions (Interos), shocks erase almost 45 percent of a year's profit over a decade (MGI), and U.S. business logistics costs ran $2.4 trillion (CSCMP).
- Money is moving: 55 percent of leaders are increasing technology investment and 60 percent plan to spend over $1 million (MHI), yet only 19 percent have fully integrated scenario planning (Gartner) and Excel is still the preferred tool for recording disruptions (BCI).
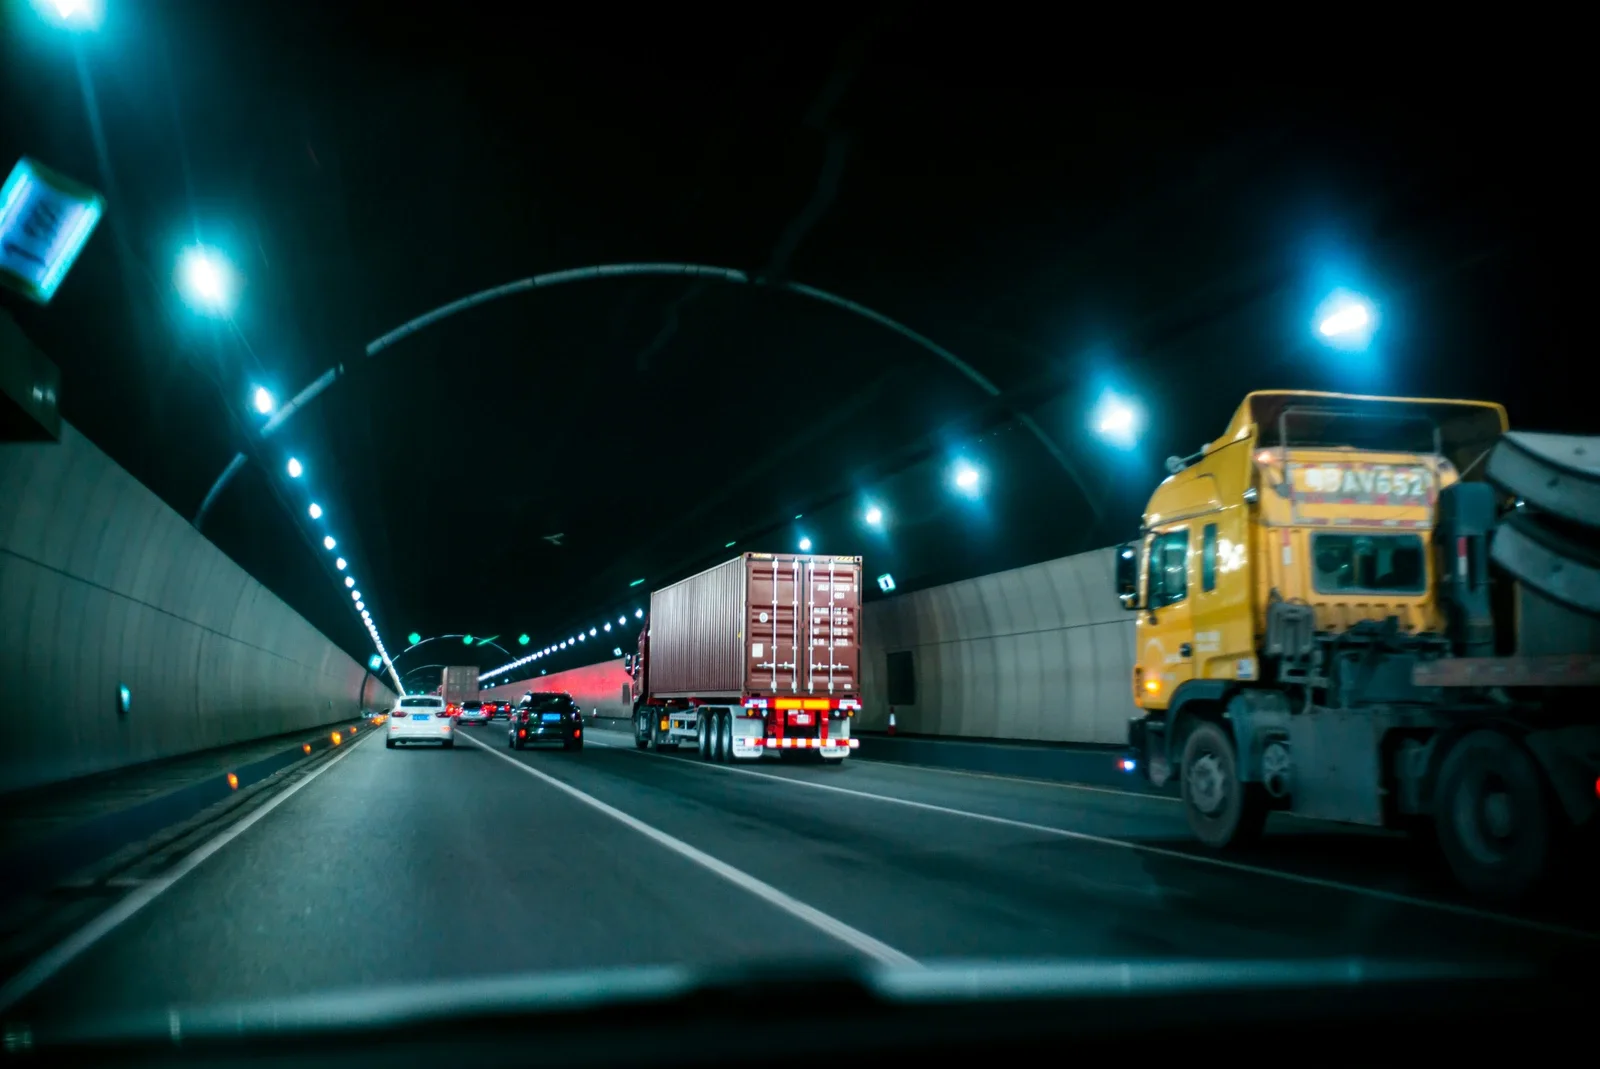
- The blind spot is in transit: trucks move 72.7 percent of U.S. freight by weight, and almost every survey above measures suppliers and facilities, not the load between them.
Here is a test. Pick a pallet that left your dock this morning. Can you say, right now, where it is, how long it has sat at its last stop and whether anything happened to it on the way? If the honest answer is "I can see the carrier's ETA," you are in good company, and you have just defined supply chain visibility by its absence.
The supply chain visibility statistics below come from the surveys logistics leaders actually cite: McKinsey's annual pulse of supply chain leaders, the Business Continuity Institute, Resilinc, the MHI Annual Industry Report, Gartner, Deloitte, Capgemini, Interos and Zebra. We organized them around five questions. How much visibility do companies really have beyond tier one? How often does the chain break? What does that cost? Where is the technology money going, and what has it bought? And why does nearly every program stop at the dock door?
What Supply Chain Visibility Is, and Why the Surveys Disagree
Supply chain visibility is the ability to see the location, status and condition of goods, and the health of the suppliers and partners behind them, across every tier and every leg, with enough timeliness to act. That definition has three layers, and most surveys measure only one of them.
- Supplier Visibility Do you know who your tier-two and tier-three suppliers are, where they sit and how exposed they are? This is what McKinsey, Deloitte and the BCI measure, and it is where the famous low percentages come from.
- Operational Visibility Can you see inventory, orders and capacity across your own network in near real time? This is the dashboard layer, and adoption here is high.
- In-Transit Visibility Do you know where a specific load is and what is happening to it between facilities? This layer is measured least and, as the last section shows, is where the physical losses happen.
Keep the layers apart as you read. A company can have a 79 percent dashboard adoption rate and a 13 percent chance of mapping its full chain at the same time; McKinsey's 2023 and Deloitte's late-2022 numbers said exactly that.
How Much Visibility Companies Really Have Beyond Tier One
McKinsey has asked the same questions every year since 2020, which makes it the best series we have. In 2022, 45 percent of 113 supply chain leaders said they "either have no visibility into their upstream supply chain or that they can see only as far as their first-tier suppliers." Only 17 percent could see to the third tier or beyond, though that was up from 2 percent a year earlier. By 2024, 60 percent of 88 leaders reported comprehensive visibility of tier-one suppliers, and the share with visibility into deeper tiers had slipped 7 percentage points from 2023, the second annual decline in a row.
Read those together and the shape is clear: companies have gotten good at the first tier and have stalled, or gone backward, past it. Deloitte's surveys bracket the same picture over a longer span. In its 2018 Global CPO Survey, just 6 percent of procurement chiefs had full transparency of their entire supply chain and 65 percent had limited visibility or none. An October 2022 Deloitte and CIPS report found 13 percent could map the entire chain, 12 percent had no visibility beyond tier one, and 72 percent had limited or partial visibility beyond tier two. Only 28 percent had visibility into Scope 3 emissions, which matters more every year as disclosure rules tighten.
| Survey | Population | Finding |
|---|---|---|
| Deloitte Global CPO Survey, 2018 | Chief procurement officers | 6% full transparency; 65% limited or none |
| McKinsey, 2022 | 113 supply chain leaders | 45% see no further than tier one; 17% see tier three or beyond |
| Deloitte and CIPS, Oct 2022 | Private-sector companies | 13% can map the entire chain; 72% partial beyond tier two |
| McKinsey, 2023 | 101 companies | 79% have end-to-end visibility dashboards |
| BCI, 2024 | Resilience professionals | 17.1% map critical suppliers to tier four and beyond, up from 3.7% |
| McKinsey, 2024 | 88 senior leaders | 60% comprehensive tier-one visibility; deeper tiers down 7 points |
The one unambiguous bright spot is mapping depth. The BCI's 2024 Supply Chain Resilience Report found 17.1 percent of respondents now analyze critical suppliers down to tier four and beyond, up from 3.7 percent in the 2023 report. That is a fourfold jump in a year, and it shows where the pain has been: most organizations in the same report traced their main disruption to the first two tiers, and 43.6 percent blamed third-party failures outright.
Why It Matters
Visibility is not a percentage you buy once. McKinsey's deeper-tier figure fell in 2024 while the tier-one figure rose, so the gap between what leaders can see and what can hurt them is widening, not closing.
Disruption Frequency: How Often the Chain Actually Breaks
If visibility is the question, disruption is why anyone asks it. The BCI's 2024 report found almost 80 percent of organizations' supply chains were disrupted over the previous twelve months, most of them between one and ten times, an increase on the year before. McKinsey's 2024 survey found 90 percent of leaders encountered supply chain challenges that year. Neither figure describes a crisis. They describe a Tuesday.
Resilinc's EventWatchAI, the risk vendor's own monitoring platform, which scans 104 million sources and analyzes data feeds in 100 languages, issued 22,522 disruption alerts in 2024, a 38 percent increase over 2023, and 59 percent were "impactful enough to trigger the creation of a WarRoom." Factory fires stayed the largest single category for the sixth straight year at 2,299 alerts, even as that number fell 20 percent. What grew was everything outside the factory: labor disruption (up 47 percent), leadership transitions (up 95 percent) and the weather and political categories in the chart below. Life sciences, healthcare, general manufacturing, high tech and automotive were the five most disrupted industries for the fourth year running.
Resilinc disruption alerts, change from 2023 to 2024
The McKinsey Global Institute put a cadence on this in 2020, after studying 23 industry value chains: companies "can now expect supply chain disruptions lasting a month or longer to occur every 3.7 years." Five years of data since have not made that look pessimistic.
What Poor Visibility Costs, in Dollars and in Profit
The honest answer to "what does a blind spot cost" is that nobody can total it, which is itself the point. The best attempts come from three directions: what companies say they lost, modeled profit at risk, and the national logistics bill those losses hide inside.
Interos, a supply chain risk platform, surveyed more than 1,500 global supply chain leaders for its Resilience 2022 report and found disruptions cost them an average of $182 million a year in lost revenue. Pharmaceuticals and life sciences fared worst at $226 million, financial services best at $143 million, and geography mattered: UK and Irish companies reported $142 million, French companies $230 million. A year earlier, Interos' survey of 900 US and EU decision-makers had put the figure at $184 million, with 94 percent reporting some negative revenue impact. Two years, two samples, one order of magnitude.
The McKinsey Global Institute approached it from the other side, modeling shock exposure across 23 value chains. Its 2020 conclusion: companies in most industries can expect losses equal to "almost 45 percent of one year's profits over the course of a decade," and a single prolonged production-only shock, modeled at 100 days, would wipe out 30 to 50 percent of one year's EBITDA for companies in most industries. Those are probability-weighted averages, not worst cases.
| Measure | Figure | Source |
|---|---|---|
| Average revenue lost to disruptions, per company | $182 million a year | Interos, 2022 (1,500+ leaders) |
| Pharma and life sciences | $226 million a year | Interos, 2022 |
| Profit erased over a decade | Almost 45% of one year's profit | McKinsey Global Institute, 2020 |
| Organizations insured against major disruption | 46.7%, up from 37.4% | BCI, 2024 |
All of it sits inside a logistics bill that CSCMP's State of Logistics Report put at $2.4 trillion for the latest year, 7.8 percent of U.S. GDP, down from $2.6 trillion and 8.7 percent in the prior edition. Companies are responding with insurance: the BCI found 46.7 percent now insure against major disruption, up from 37.4 percent a year earlier. Insurance is a sensible hedge, and a confession that the organization expects to learn about the loss afterward. Our post on what the pallet really costs traces how the same losses scatter across four budgets so nobody sees the total.
Technology Adoption and Where the Visibility Money Is Going
Nobody disputes the diagnosis; the spending shows it. In the 2025 MHI Annual Industry Report, drawn from more than 700 manufacturing and supply chain leaders, 55 percent are increasing supply chain technology investment, 60 percent plan to spend over $1 million and 19 percent over $10 million. Zebra's 2023 study, a vendor-commissioned survey of more than 1,400 warehouse decision-makers and associates, found 91 percent of decision-makers plan to invest in technology to increase supply chain visibility by 2028, and in 2022 Interos found 77 percent planned to add visibility technology within 12 months.
Technologies leaders expect to have adopted within five years (MHI, 2025)
Now the other half of the ledger. McKinsey found two-thirds of leaders investing in advanced planning systems in 2024 but only 10 percent had completed the deployments; a third had no quantified business case and 15 percent had already missed their objectives. End-to-end visibility dashboards went from 67 percent of respondents in 2022 to 79 percent in 2023, yet the deeper-tier visibility they are meant to deliver went down in 2024. Gartner's December 2024 survey of 506 leaders found only 19 percent fully integrate scenario planning into strategy, and its survey of 579 practitioners found just 29 percent had built at least three of the five characteristics it ties to future performance. Only 11 percent monitored supplier risk continuously in Interos' 2022 survey. And in the BCI's 2024 report, the preferred tool for recording supply chain disruptions was still an Excel spreadsheet.
- The Talent Gap Has Not Moved 90 percent of McKinsey's 2024 respondents report insufficient digital talent, unchanged, the firm notes, since 2020. In 2023 only 8 percent said they had enough.
- The Board Is Hearing Less Only a quarter of companies have a formal process for discussing supply chain issues at board level, and the share with a regular risk reporting cadence fell from almost half to a quarter in a year (McKinsey, 2024).
Watch Out
A dashboard that updates when a supplier sends a file or a carrier pings an ETA is only as current as the party that fed it. Adoption of the screen is rising faster than the quality of what is on it.
The Benefits of Supply Chain Visibility That Companies Can Measure
So is the value of supply chain visibility real, or just well marketed? The measured evidence says real, with a condition: the payoff shows up for the companies that finish the job. Capgemini's December 2022 study of 1,000 supply chain executives in 13 countries found fewer than 20 percent felt equipped to handle disruption, but the 9.5 percent it classed as "supply chain masters" had realized 15 percent incremental revenue growth, 17 percent CO2 reductions and a 1.8 point gain in market share.
EY's 2022 survey of 525 senior supply chain executives across the Americas found 58 percent prioritizing end-to-end visibility and 47 percent resilience, with 70 percent having seen or expecting increased revenue from sustainable supply chain work within one to three years. McKinsey's series shows the structural moves visibility enables: dual sourcing went from 55 percent of respondents in 2020 to 81 percent in 2022, with 73 percent reporting progress on it in 2024, and regionalization climbed from 25 percent in 2021 to 64 percent in 2023. You cannot dual-source a part you cannot see.
There is a quieter benefit the surveys capture by accident: credibility. Gartner's March 2025 survey of 201 executives, as reported by DIGIT, found three-quarters of chief supply chain officers rated their own effectiveness at 75 out of 100 or better, while only a little more than half of their C-suite peers agreed, and nearly 40 percent of those peers said the CSCO falls short at explaining why the supply chain matters. Visibility you can show on a screen, with a timestamp, closes that gap faster than any slide.
The Benefits, Stated Plainly
- Faster Decisions Capgemini's masters and McKinsey's dual-sourcers share a trait: they could see the problem early enough to have options.
- Defensible Records When a loss is disputed, a timestamped record settles the who-pays question that Incoterms frame but cannot prove.
- Measured Sustainability Only 28 percent of companies had Scope 3 visibility in the Deloitte and CIPS report. Visibility into movement is the raw material for a number an auditor will accept.
The In-Transit Blind Spot, and Where the Pallet Layer Fits
Look back at every survey above and notice what they measure: suppliers, facilities, dashboards, planning systems. Almost none ask whether the company can see a load while it is moving. Yet that is where the goods are. The American Trucking Associations reports trucks moved 11.27 billion tons in 2024, roughly 72.7 percent of U.S. freight by weight, for a freight bill of about $906 billion, carried by 3.58 million drivers. Every one of those loads left a building with visibility and entered a truck with, at best, an ETA.
The maturity ladder in Accenture's survey of 30 supply chain leaders, small as that sample is, describes the problem precisely: 77 percent monitor data from suppliers and customers, 63 percent use it to predict, 27 percent use it prescriptively and 3 percent let it adjust operations on its own. Most organizations are collecting other people's data about their own goods. The BCI's 43.6 percent third-party failure rate is the same fact seen from the loss side. When the carrier's system is the source of truth, the carrier's problem becomes your blind spot.
This is the gap APS was built to close, and the pallet is where to close it: it is the one asset physically present at every node, from the supplier's dock to the customer's receiving bay. An APS Smart Pallet carries an embedded sensor module, built into the pallet rather than bolted on, with cellular GPS location plus temperature, humidity and shock. It needs no scanning, no facility infrastructure and no carrier cooperation, and it reports on exception: quiet when conditions are normal, awake the moment the pallet moves or a threshold is crossed. Pulse routes that exception to the person who can act on it and leaves an independent, timestamped chain of custody at every handoff.
- Visibility Where the Surveys Stop Location and condition from the pallet itself, in transit, rather than from a reader at a door or a file from a supplier.
- Accountability Nobody Can Dispute A record generated by the asset that made the trip, which is what a denied claim, a chargeback or an Incoterm dispute has always lacked.
- Dwell Time by Facility and Lane Pulse reports how long pallets sit and where, so the DC that turns in two days and the one that takes six stop being a mystery.
- A Foundation That Behaves The pallet is 100 percent recycled HDPE, dimensionally consistent to under 1 percent and up to 30 percent lighter than wood, so the data rides on a platform that automation can trust.
The commercial model matters as much as the sensor. The program is an all-inclusive monthly lease designed to price at or below what companies already pay for wood pallet programs, covering pallets, sensors, exception reporting and visibility in one flat cost. Our savings calculators estimate the hidden costs on your own lanes, and the closed loop means every pallet comes back and is recycled into the next one, which keeps the Scope 3 number measured rather than estimated.
Key Takeaway
The surveys agree: companies can see tier one, cannot see much past it, get disrupted most years and pay nine figures for it. The treatment most are buying is a better view of other people's data. The pallet is the one asset that can generate its own.
Most visibility programs end where the freight begins: at the dock door.
If your freight moves across any of the seven industries we build programs for, the question worth asking is not whether you need more visibility. It is where your data currently stops, and what it would be worth to move that line onto the truck. An APS expert can show you what a tracked fleet would say about your lanes. Let's Talk.
Sources
- McKinsey, “Supply chains: Still vulnerable,” Global Supply Chain Leader Survey, 2024
- McKinsey, “Tech and regionalization bolster supply chains, but complacency looms,” 2023
- McKinsey, “Taking the pulse of shifting supply chains,” 2022
- McKinsey Global Institute, “Risk, resilience, and rebalancing in global value chains,” 2020
- Business Continuity Institute, “Supply Chain Resilience Report 2024” (launch release), 2024
- Resilinc, “Resilinc Reveals the Top 5 Supply Chain Disruptions of 2024” (EventWatchAI data), 2025
- Adhesives & Sealants Industry on Resilinc, “Resilinc Reports 40% Increase in Global Supply Chain Disruptions in 2024,” 2025
- Interos, “Resilience 2022: Interos Annual Global Supply Chain Report,” 2022
- Security Magazine on Interos, “Global supply chain disruptions cost companies $184 million annually,” 2021
- Capgemini Research Institute, “Only one in five organisations feels equipped to handle disruptions in the global supply chain,” 2022
- MHI and Deloitte, “2025 MHI Annual Industry Report,” via Intelligent CIO, 2025
- MHI Solutions Magazine, “Supply Chain Visibility” (Deloitte and CIPS, Accenture figures), 2023
- SupplyChainBrain, “Six Percent of CPOs Have Full Supply Chain Visibility, Survey Says” (Deloitte Global CPO Survey), 2018
- Gartner, “Gartner Survey Shows Only 29% of Supply Chain Organizations Have Built Necessary Capabilities to Deliver on Future Performance,” 2025 (also reported by IT Supply Chain)
- IT Supply Chain on Gartner, “Only 29% of Supply Chain Organizations Have Built Necessary Capabilities,” 2025
- Gartner, “Gartner Says Supply Chain Leaders Should Prioritize Advanced Data Visibility and Scenario Planning,” Supply Chain Symposium/Xpo release (506-leader scenario planning survey), 2025
- Gartner, as reported by DIGIT, “Chief Supply Chain Officers: Overly Confident or Undervalued?” 2025
- Zebra Technologies, “Nearly Six in 10 Warehouse Leaders Plan to Deploy RFID by 2028” (Warehousing Vision Study), 2023
- EY, “A majority of supply chain executives are focused on ESG but lack capabilities,” via NDTA, 2022
- American Trucking Associations, “Economics and Industry Data,” 2024 figures
- CSCMP, “State of Logistics Report,” 2026 edition
FAQ
What Is Supply Chain Visibility?
Supply chain visibility is the ability to see the location, status and condition of goods, and the health of the suppliers behind them, across every tier and every leg, in time to act. It has three layers: supplier visibility (who your tier-two and tier-three suppliers are), operational visibility (inventory and orders across your own network) and in-transit visibility (where a specific load is and what is happening to it between facilities). Most surveys measure only the first.
Why Is Supply Chain Visibility Important?
Because disruption is routine. The BCI found almost 80 percent of organizations' supply chains were disrupted in the past 12 months, Resilinc logged 22,522 disruption alerts in 2024, up 38 percent, and Interos found disruptions cost companies an average of $182 million a year in lost revenue. Visibility turns those events from losses you discover afterward into exceptions you can act on in time.
How Many Companies Have Visibility Beyond Tier One Suppliers?
McKinsey's 2024 survey found 60 percent of supply chain leaders had comprehensive visibility of tier-one suppliers, with deeper-tier visibility down 7 points from 2023, and in 2022, 45 percent could see no further than tier one. A Deloitte and CIPS report from October 2022 found only 13 percent could map their entire chain, and the BCI found 17.1 percent map critical suppliers to tier four and beyond, up from 3.7 percent a year earlier.
What Are the Benefits of Supply Chain Visibility?
Faster decisions, lower loss and dispute costs, and credible sustainability data. Capgemini found the 9.5 percent of companies it called supply chain masters realized 15 percent incremental revenue growth and a 1.8 point market share gain. Visibility also enables structural moves like dual sourcing, which McKinsey found rose from 55 percent of leaders in 2020 to 81 percent in 2022, and it produces the timestamped records that settle freight claims and chargebacks.
What Is the Difference Between Supplier Visibility and In-Transit Visibility?
Supplier visibility is knowing who makes what for you, how many tiers deep, and how exposed each one is; it is built from supplier data, mapping and risk monitoring. In-transit visibility is knowing where a specific shipment is and what it is experiencing between facilities, which requires data generated by the load itself. Trucks moved 72.7 percent of U.S. freight by weight in 2024, and most programs rely on carrier updates for that leg. APS Smart Pallets close the gap with an embedded cellular GPS and condition sensor that reports on exception.
Featured Posts From the APS Blog
How a Viral Cargo Theft Made the Case for Smart Pallets
Cargo theft losses across the US and Canada surged 60% to nearly $725 million, with food and beverage hit hardest and automotive supply chains increasingly exposed.
 Rodrigo CastroCo-Founder & President5 min read
Pallets, Paperwork, and Proof: How Two of the Least Sexy Industries Finally Found Each Other
Incoterms decide the exact point where risk transfers from seller to buyer. Almost nobody has the data to enforce what they are supposed to guarantee.
Rodrigo CastroCo-Founder & President6 min read
The Pallet Is Costing You More Than You Think
You have invested millions in automation and you track labor, freight and energy to the decimal. Somewhere on your dock, a wooden pallet is about to stop the line.
Rodrigo CastroCo-Founder & President10 min read